
Performance page design after the revamp (V4 design)
Report generator
Context & Challenge
The merger of IronSource and Unity created a need for a unified interface language and an upgraded technological infrastructure across existing reporting pages. The legacy codebase made issue tracking challenging and limited the development of new features that users had identified as key workflow pain points.
Several essential features were missing, and the design system was outdated. As one of the platform’s core pages, the Performance page required improved usability and the addition of meaningful, practical features to better support users’ daily work.
As part of the revamp, we also evaluated other reporting pages with the potential to consolidate them. From this perspective, we decided to incorporate user activity metrics directly into the Performance page, creating a more comprehensive and efficient reporting experience.
Goals
• Create an advanced reporting page
• Improve the UX of our reporting pages
• Platform revamp - V4 design systems
Scope
New Capabilities
-
Designed and implemented a dynamic, advanced table view to improve data exploration and readability
-
Introduced secondary sorting to enable deeper and more flexible data analysis
Product & UX Improvements
-
Consolidated Manage Reports under Saved Reports to reduce UI complexity and improve discoverability
-
Moved report scheduling to a post-creation step, allowing users to review insights before committing to automation
-
Reframed Send Report Now as Export to better align with user intent and mental models
About the page
The platform performance page is the most widely used and adopted page on the platform, providing valuable insights and analytics that enable users to better understand their monetization performance. With in-depth filters and helpful breakdowns, their Performance Reports provide the necessary granular data you need to make informed decisions to achieve monetization success.
Context & Challenge
Following the IronSource–Unity merger, there was a clear need for a unified design language and an upgraded technological infrastructure across existing reporting pages. The legacy codebase made issue tracking challenging and hindered the development of new features that address users’ critical workflow pain points.
At the outset, several key features were missing, and the design system was outdated. As this is a core page of the platform, our goal was to improve usability and provide meaningful, practical features.Additionally, as part of the revamp, we looked at other reporting pages with the possibility of consolidating them. From this perspective, we decided to incorporate user activity metrics into the Performance page.
My role
Product designer
Team
Unity Levelplay
Brief
Page revamp
Goals
• Improve the UX of our reporting pages
• Support key product feature requests
• Revamp the platform using the V4 design system
Approach
We conducted extensive research into competitors with similar products, ensuring that our redesign would address user pain points and include features missing from other solutions.
User interviews were carried out to uncover pain points and gather requests for future features. We also created customer journey maps to better understand the user experience and identify key opportunities for improvement.
About the page
The Platform Report Generator is a key capability that allows publishers to receive scheduled reports sent to predefined email addresses. We aim to enhance this experience by enabling publishers to create advanced, dynamic reports, edit them in real time, and schedule them only after reviewing the results directly within the dashboard.
This enhancement provides a competitive advantage over MAX’s advanced reporting solution—a capability we currently lack and which has been consistently identified as a product gap by our users.
My role
Product designer
Company
Unity Technologies
Team
Levelplay
About the page
The platform performance page is the most widely used and adopted page on the platform, providing valuable insights and analytics that enable users to better understand their monetization performance. With in-depth filters and helpful breakdowns, their Performance Reports provide the necessary granular data you need to make informed decisions to achieve monetization success.
Context & Challenge
Following the IronSource–Unity merger, there was a clear need for a unified design language and an upgraded technological infrastructure across existing reporting pages. The legacy codebase made issue tracking challenging and hindered the development of new features that address users’ critical workflow pain points.
At the outset, several key features were missing, and the design system was outdated. As this is a core page of the platform, our goal was to improve usability and provide meaningful, practical features.Additionally, as part of the revamp, we looked at other reporting pages with the possibility of consolidating them. From this perspective, we decided to incorporate user activity metrics into the Performance page.
My role
Product designer
Team
Unity Levelplay
Brief
Page revamp
Goals
• Improve the UX of our reporting pages
• Support key product feature requests
• Revamp the platform using the V4 design system
Approach
We conducted extensive research into competitors with similar products, ensuring that our redesign would address user pain points and include features missing from other solutions.
User interviews were carried out to uncover pain points and gather requests for future features. We also created customer journey maps to better understand the user experience and identify key opportunities for improvement.
About the page
The platform performance page is the most widely used and adopted page on the platform, providing valuable insights and analytics that enable users to better understand their monetization performance. With in-depth filters and helpful breakdowns, their Performance Reports provide the necessary granular data you need to make informed decisions to achieve monetization success.

Report generator page design before the revamp (V1 design)

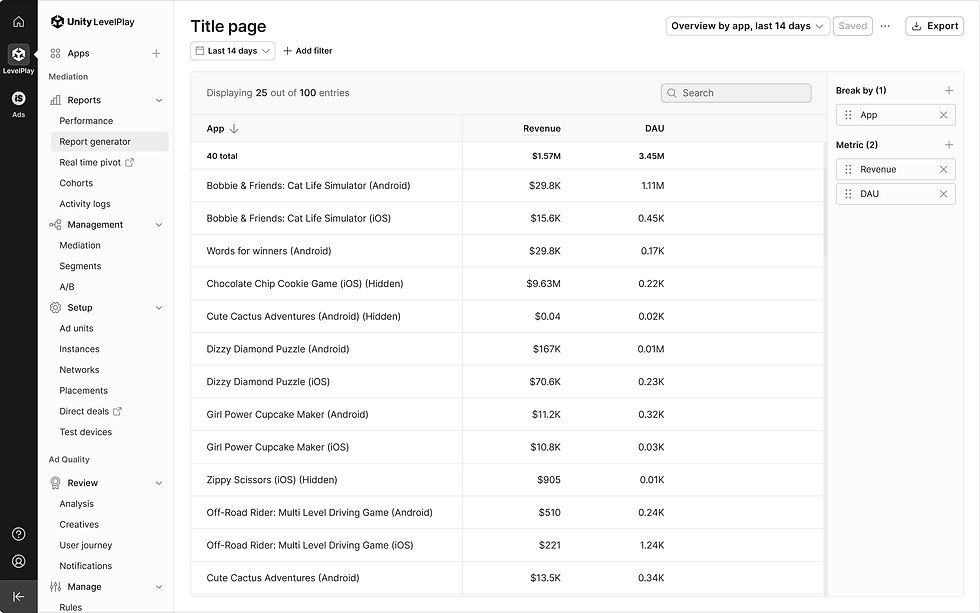
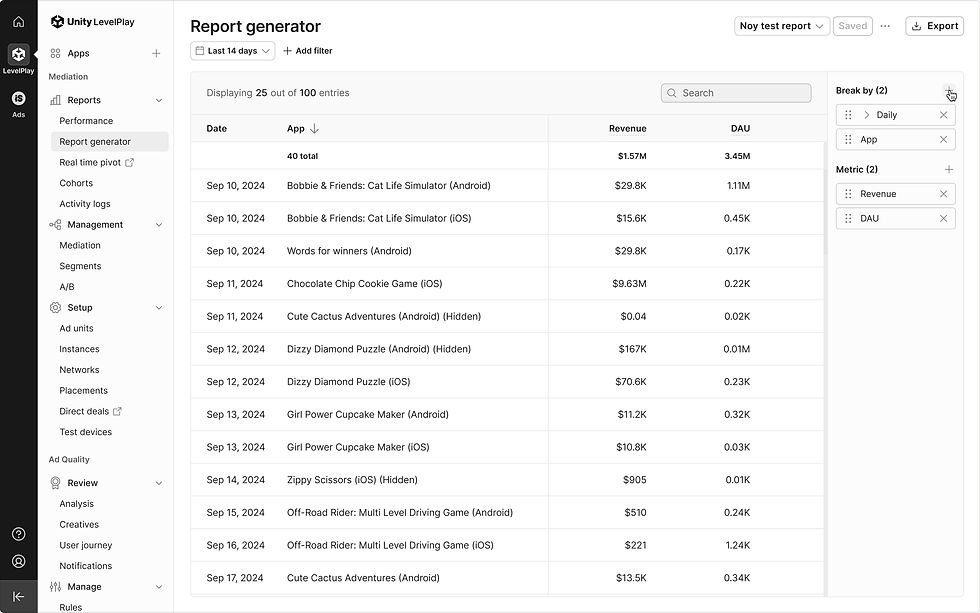
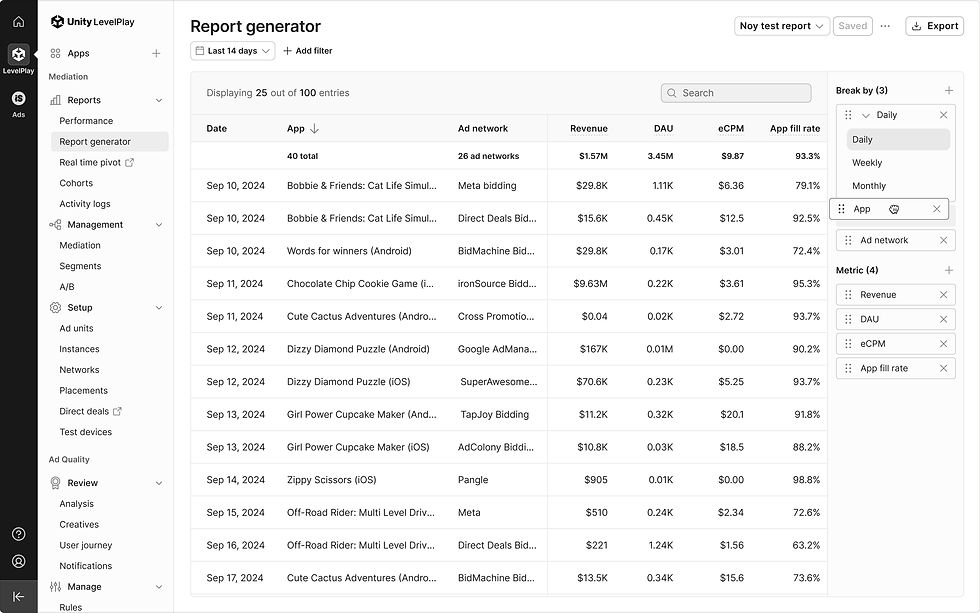
Report generator page design after the revamp (V4 design)
Performance page design after the revamp (V4 design)

Report generator reports page in Unity’s interface

????

Error states & Loaders | Error states

Error states & Loaders | Loading
Time interval and date range | None

Time interval and date range | Daily
Time interval and date range | Weekly
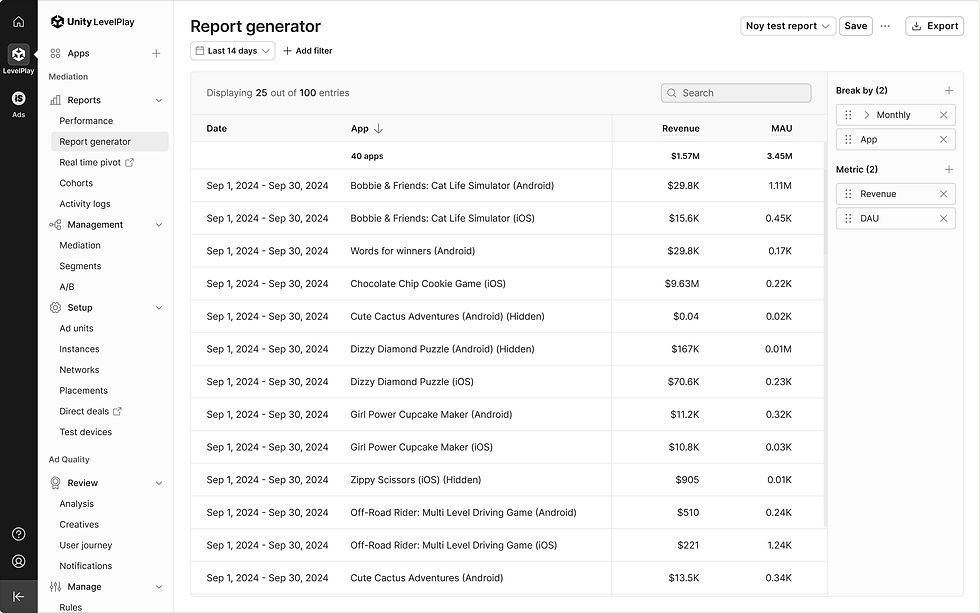
Time interval and date range | Monthly
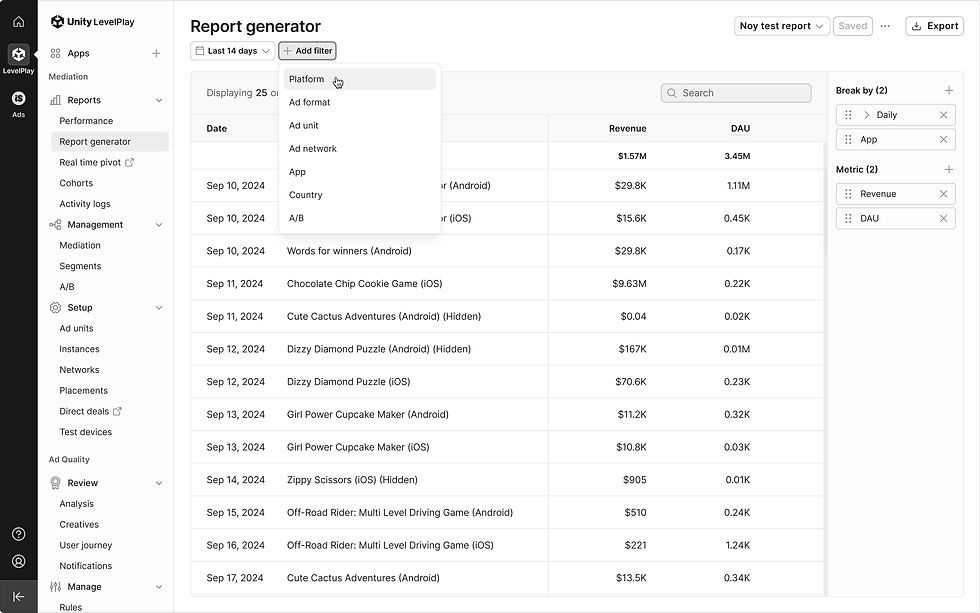
Filters | App
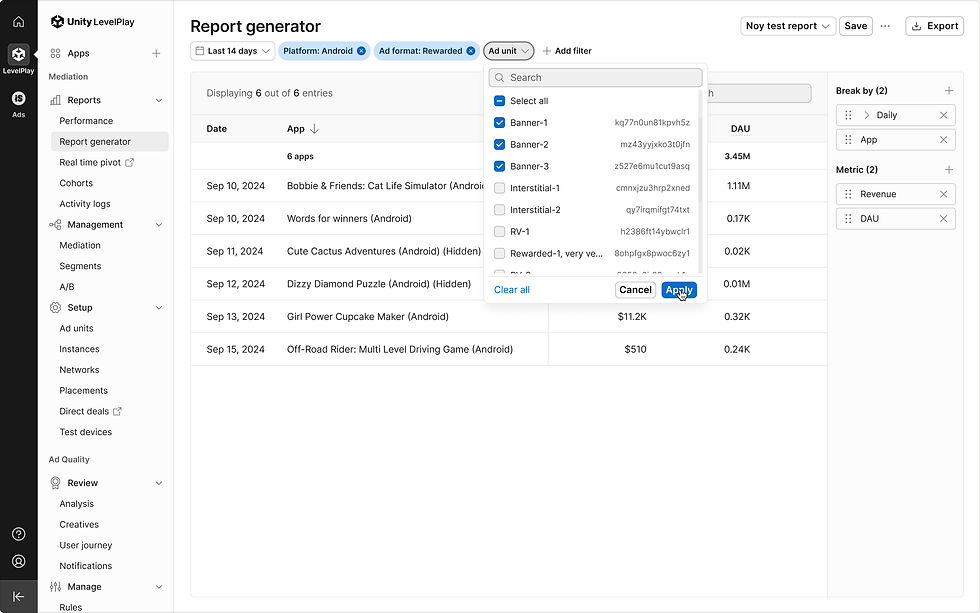
Filters | Ad unit
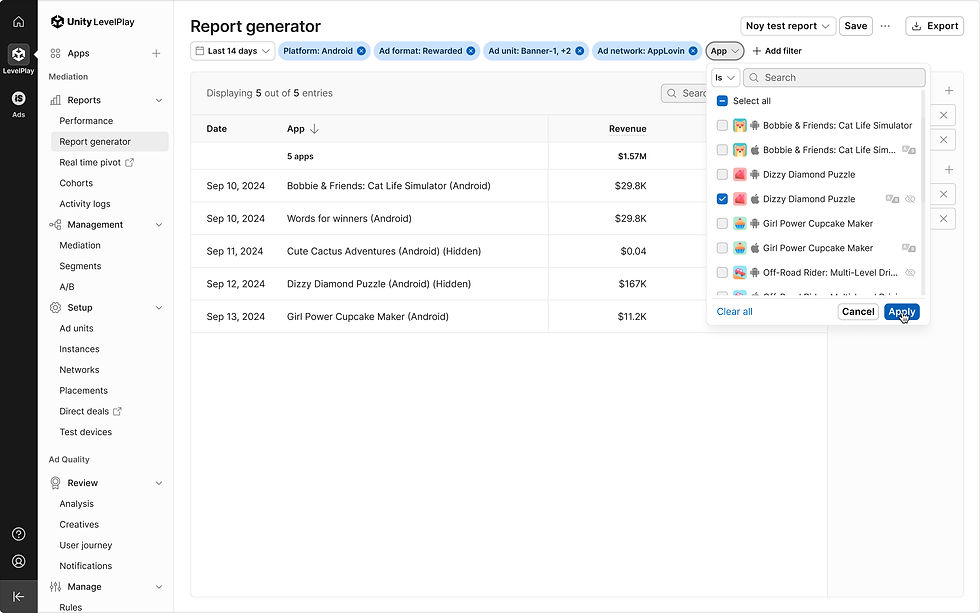
Filters | App

Filters| App (hover)

Filters | Country
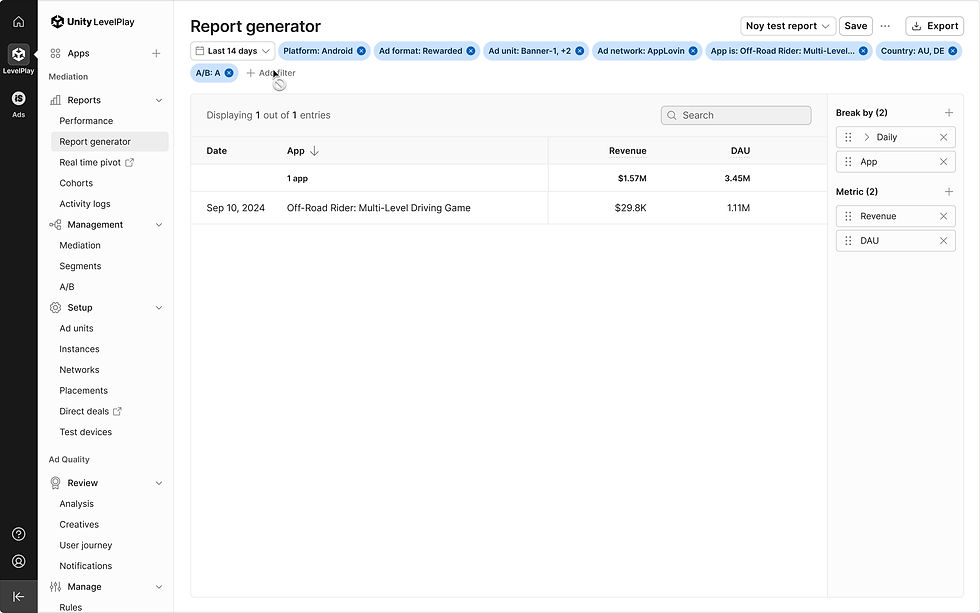
Filters | Selecting a single app which is or has run an A/B test

Drag and drop guidelines

Empty state | No metrics and breakdown selected

Metrics & breakdown multiple lists with metrics limitation | Metric limitations

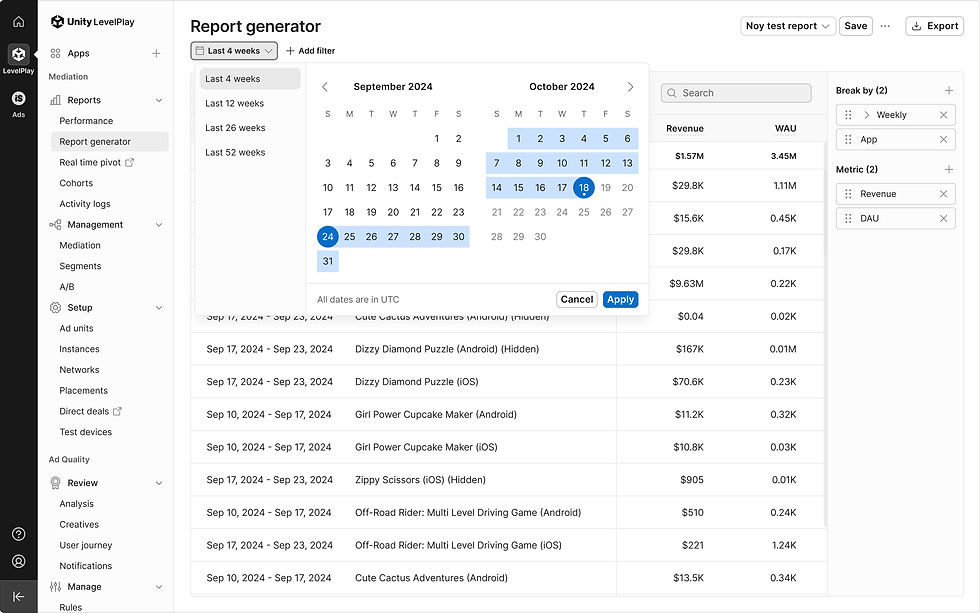
Select time interval | Select date

Select time interval | With date (Daily)

Select time interval | Date open > Select 'Weekly'

Select time interval | Table loader

Select time interval | Weekly
Selecting columns | Adding breakdowns
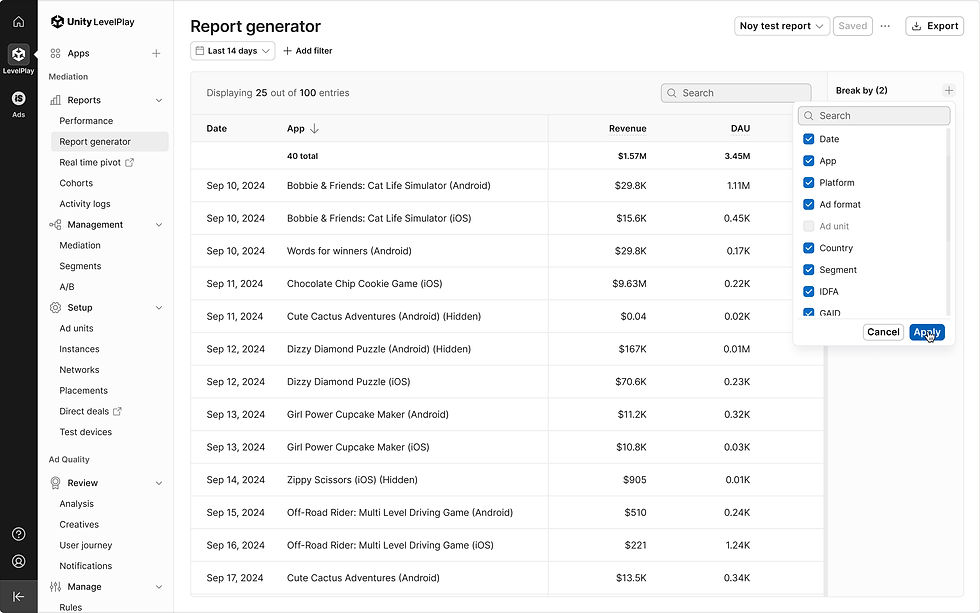
Selecting columns | Select Breakdowns
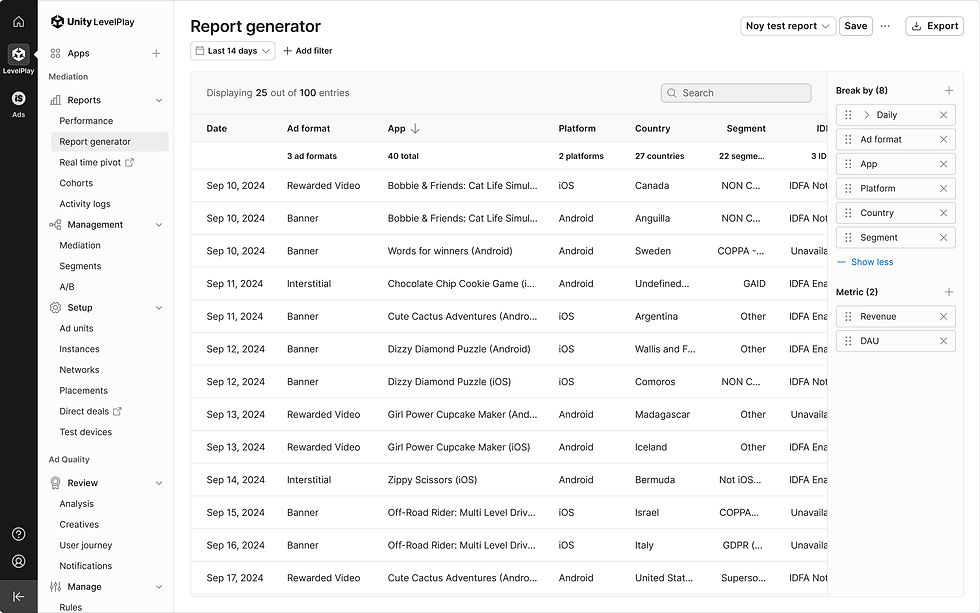
Selecting columns | Show more Breakdowns
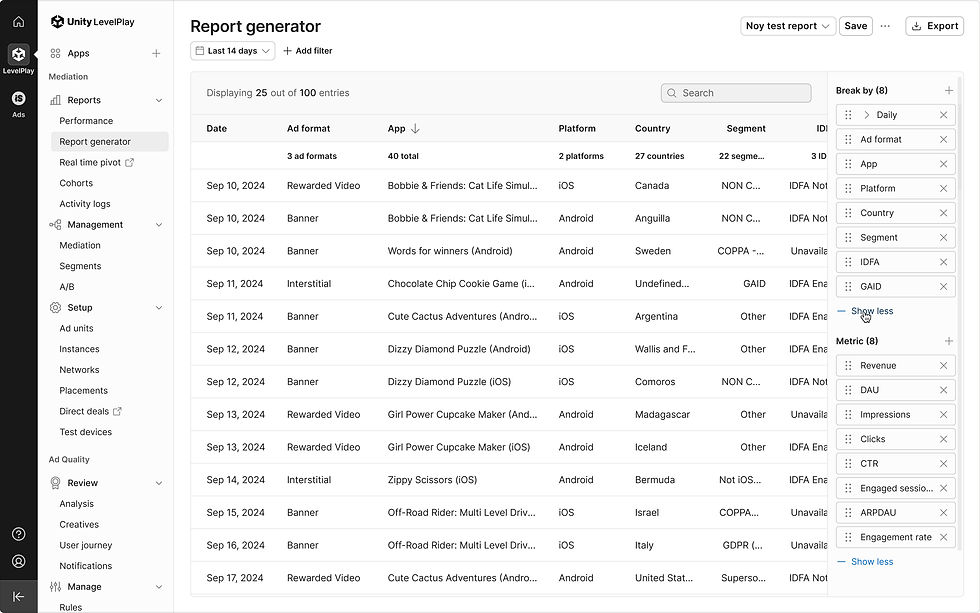
Selecting columns | Show less (Break by)

Selecting columns | Show less (Break by)

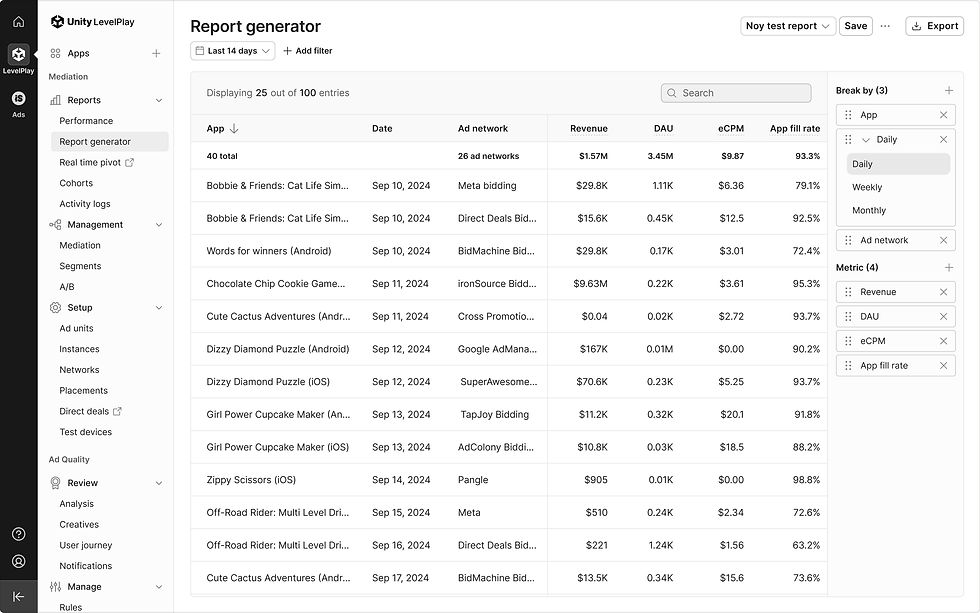
Switching columns | Switch columns
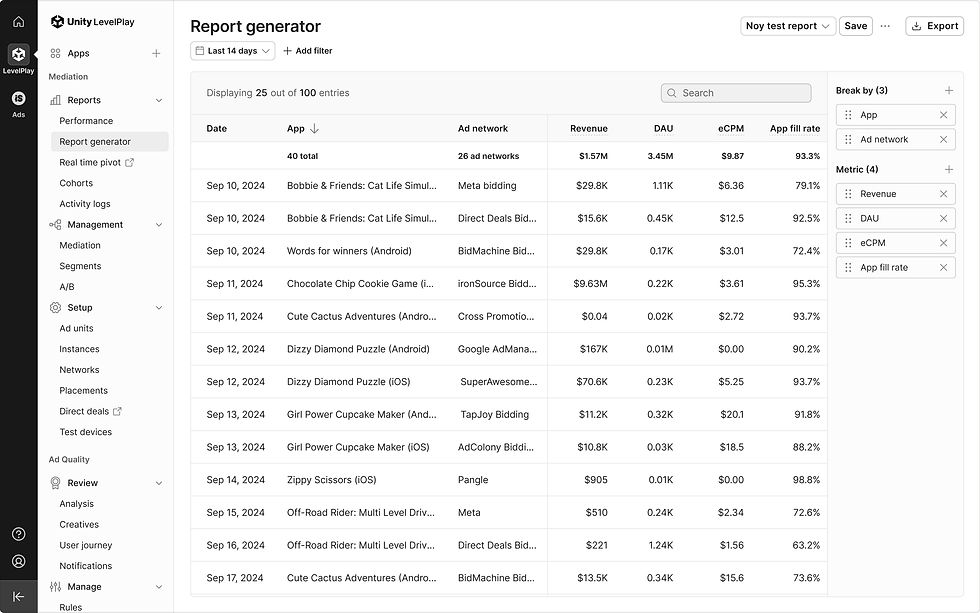
Switching columns | Columns switched
Switch columns with date open

Switch columns with date open | The date card gets closed while dragging
Switch columns with date open | The date card gets open after dragging

Deleting column | Delete app column

Deleting column | Table loader

Deleting column | Columns deleted

Limited dragging area
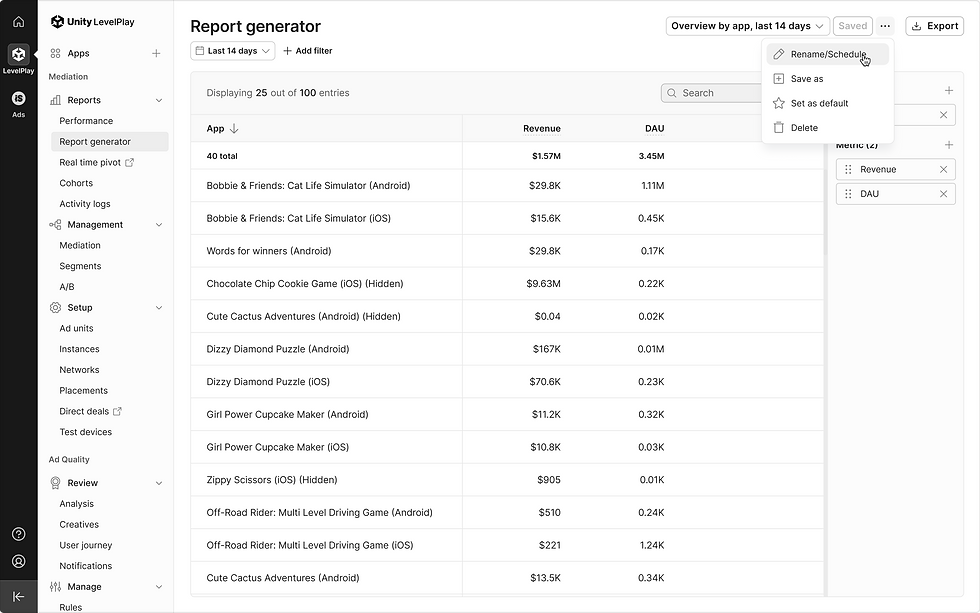
Save reports | Rename/Schedule

Save reports | Rename/Schedule report

Save reports | Your report is now saved
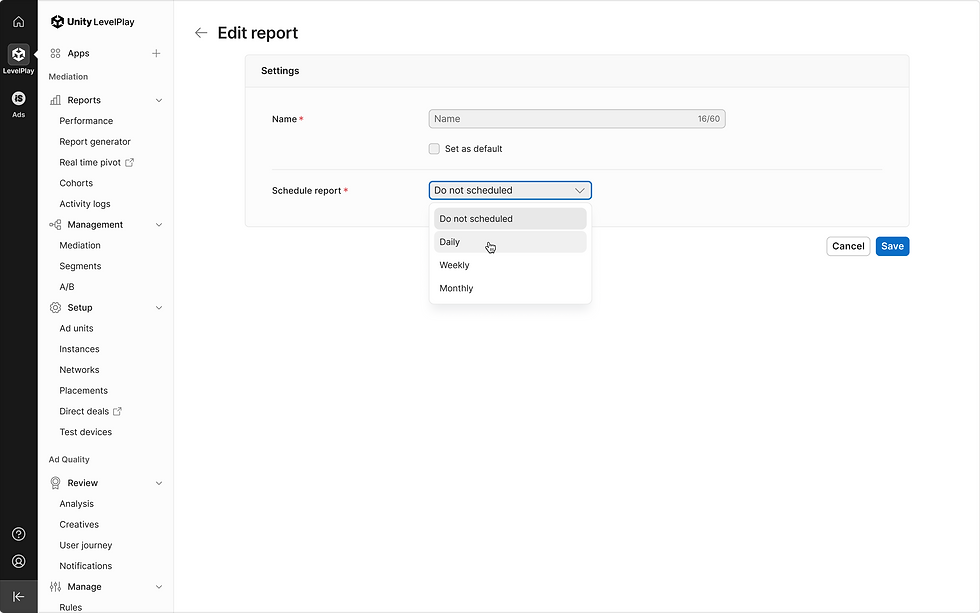
Save reports | Edit report > Frequency (Daily)

Save reports | Edit report > Frequency (Daily)

Save reports | Edit report > Frequency (Weekly)

Save reports | Edit report > Frequency (Monthly)

Validations | Rename/Schedule report

Report generator default
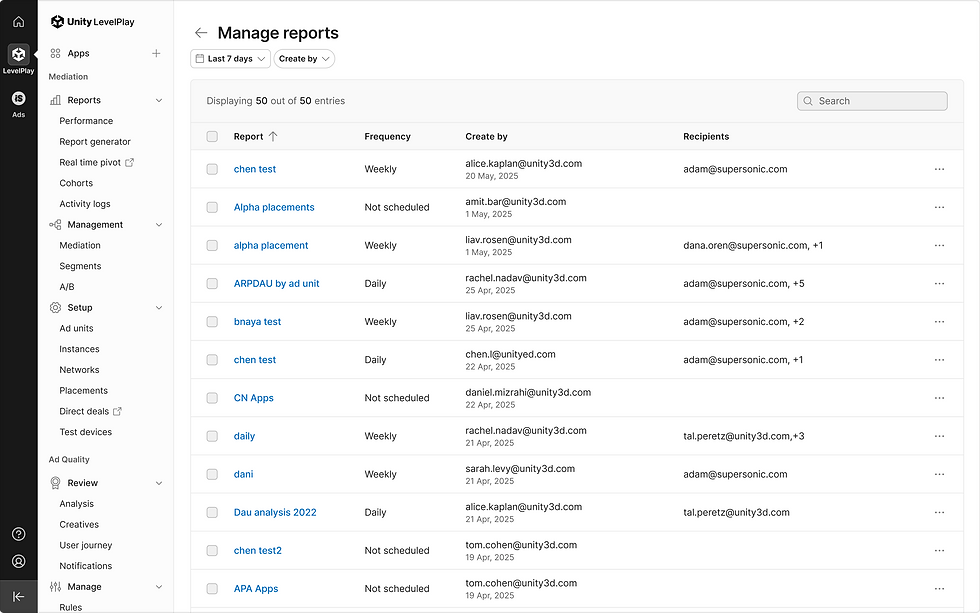
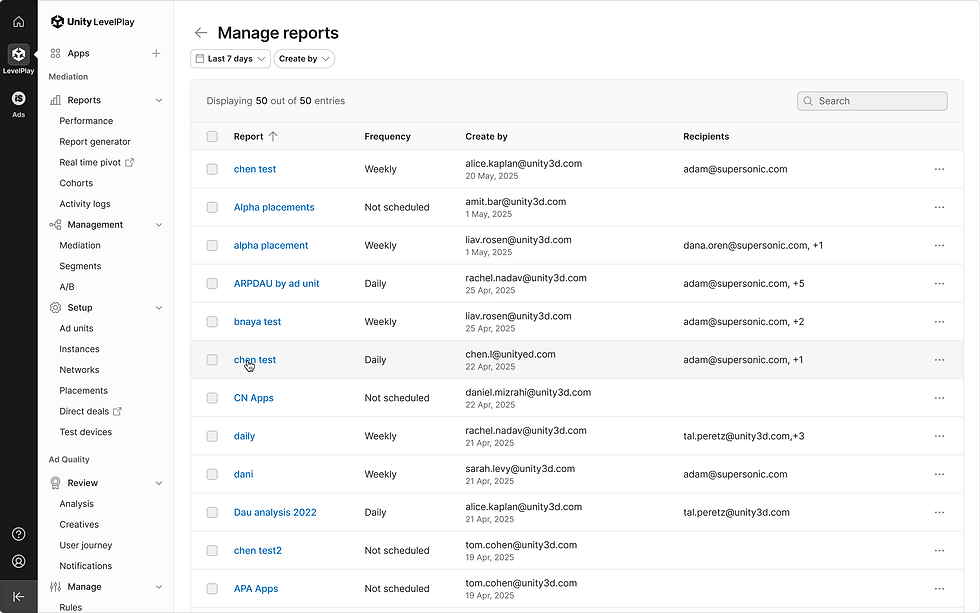
Manage reports default
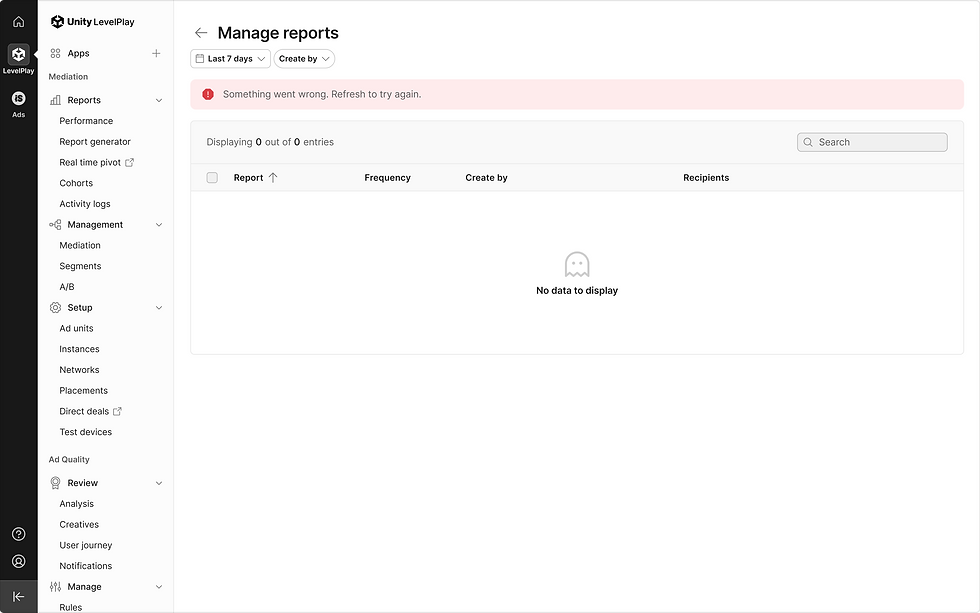
Manage reports | Error state
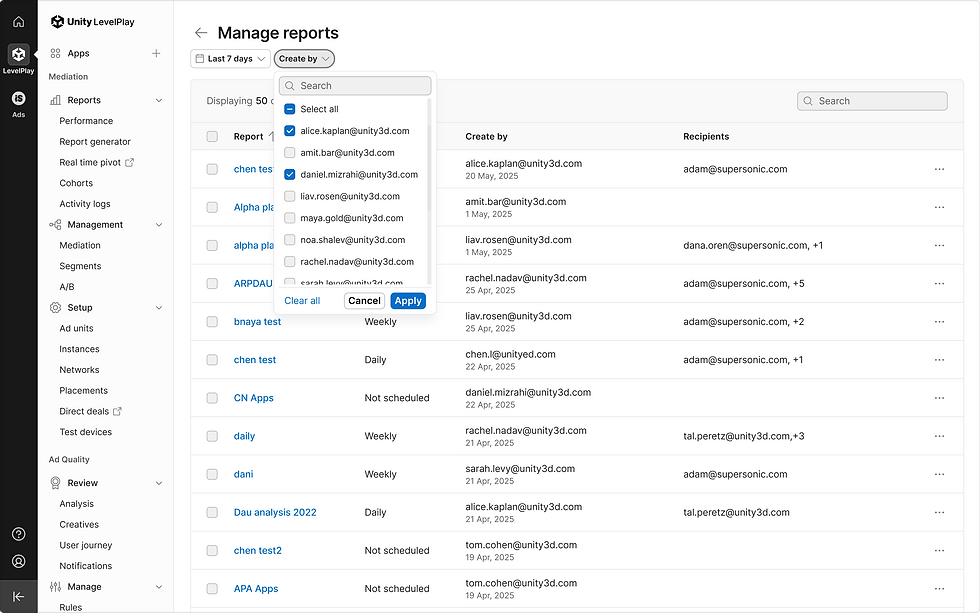
Manage reports | Filters

Manage reports | Table search

Manage reports | Edit

Manage reports | Edit

Manage reports | Delete (Multi select)

Manage reports | Tooltip_5 email addresses
Manage reports | View report

Manage reports | View report
Added functionalities
General
-
Filter by Date range and time interval (None, Daily, Weekly, Monthly)
-
Updated filters
-
New table alignments and advanced edit column (Separation between breakdown/metrics—This update is designed to give you greater flexibility and control over the monetization data while making it more efficient to create custom.)
Customize columns
-
Metrics & breakdown multiple lists with metrics limitation.
-
Select time interval option
-
Select and manage columns, expand or reduce the breakdowns or metrics list, and switch or delete columns when needed.
-
Easily build reports using the intuitive table format
-
Save report configurations for future use, with options to rename, schedule (including frequency settings), save as, set as default, or delete.
-
Schedule and export reports directly to your desired email address
Manage reports
-
Quickly view and manage all reports in one dedicated page, with edit and delete options for every report.